2018
ANNUAL REPORT
Financial
Highlights
Total Income
Total income rose 6% to $9.12 billion, led by strong growth in both net interest income and net fee and commission income.
Net interest income grew 13% to $6.22 billion, driven by broad-based loan growth and higher net interest margin. Net interest margin increased five basis points to 1.82%, in line with the rising interest rate environment.
Net fee and commission income for the year increased 5% to $1.97 billion, driven by the strong performance in loan-related, credit card, trade-related and fund management fees. Other non-interest income declined 20% to $930 million mainly due to unrealised mark-to-market on investment securities and lower gains from sale of investment securities.
$9,116
million
+ 6%
Net Profit After Tax
Net earnings for the year rose to a new high of $4.01 billion, up 18% from a year ago.
$4,008
million
+ 18%
Customer Loans/Deposits
Customer deposits grew 7% to $293 billion, led by growth in Singapore Dollar deposits.
The Group's funding position continues to be strong with healthy loan-to-deposit ratio at 88.2% as at 31 December 2018.
Spurred by strong capital and funding, net customer loans grew 11% from a year ago to $259 billion in 2018. The growth was broad-based across all territories and industries.
The Group's funding position continues to be strong with healthy loan-to-deposit ratio at 88.2% as at 31 December 2018.
Spurred by strong capital and funding, net customer loans grew 11% from a year ago to $259 billion in 2018. The growth was broad-based across all territories and industries.
Note: Net customer loans were net of total allowance.
Net Customer Loans
$259
billion
+ 11%
Customer Deposits
$293
billion
+ 7%
Loan/Deposit ratio
88.2
%
+ 3.1% pt
Shareholders’ Equity/Return on Equity
Return on equity improved to 11.3% driven by record earnings in 2018.
Shareholders' equity increased 2% from a year ago to $37.6 billion as at 31 December 2018, mainly driven by higher retained earnings.
Shareholders' equity increased 2% from a year ago to $37.6 billion as at 31 December 2018, mainly driven by higher retained earnings.
Shareholders’ Equity
$37.6
billion
+ 2%
Return on Equity
11.3
%
1.1% pt
Total Assets/Return on Assets
Return on assets for 2018 similarly increased to 1.07% on improved earnings.
The Group's total assets grew 8% to $388 billion in 2018 mainly on higher loan volume.
The Group's total assets grew 8% to $388 billion in 2018 mainly on higher loan volume.
Total Assets
$388
billion
+ 8%
Return on Assets
1.07
%
+ 0.09% pt
Capital Adequacy Ratio (CAR)
As at 31 December 2018, the Group's strong capital position remained well above the MAS minimum requirements with Common Equity Tier 1 and Total CAR at 13.9% and 17.0% respectively.
CET1 CAR
13.9
%
- 1.2% pt
Total CAR
17.0
%
- 1.7% pt
Loans by Geography
Singapore, which accounted for 52% of Group loan base, registered 8% growth year on year to reach $137 billion while regional countries contributed a strong growth of 15%.
Note: Loans by geography are classified according to where credit risks reside, largely represented by the borrower's country of incorporation/operation for non-individuals and residence for individuals.
$262
billion
+ 11%
Overseas Profit Before Tax Contribution
The Group's net profit before tax was 15% higher at $4.83 billion. Contributions from overseas was slightly lower at 39.6% in 2018 when compared with 40.8% a year ago.
39.6
%
- 1.2% pt
Five-Year Group Financial Summary
2014
2015
2016
2017
2018
Selected Income Statement Items ($ million)
Total income1
7,258
7,807
7,790
8,563
9,116
Total expenses1
2,947
3,356
3,425
3,739
4,003
Operating profit1
4,311
4,451
4,365
4,824
5,113
Net profit after tax2
3,249
3,209
3,096
3,390
4,008
Selected Balance Sheet Items ($ million)
Net customer loans
195,903
203,611
221,734
232,212
258,627
Customer deposits
233,750
240,524
255,314
272,765
293,186
Total assets
306,736
316,011
340,028
358,592
388,099
Shareholders’ equity2
29,569
30,768
32,873
36,850
37,628
Financial Indicators (%)
Cost/Income ratio
40.6
43.0
44.0
43.7
43.9
Non-performing loans ratio
1.2
1.4
1.5
1.8
1.5
Return on average ordinary shareholders’ equity
12.3
11.0
10.2
10.2
11.3
Return on average total assets
1.10
1.03
0.95
0.98
1.07
Return on average risk-weighted assets
1.94
1.74
1.51
1.63
1.93
Capital adequacy ratios
Common Equity Tier 1
13.9
13.0
13.0
15.1
13.9
Tier 1
13.9
13.0
13.1
16.2
14.9
Total
16.9
15.6
16.2
18.7
17.0
Per ordinary share
Basic earnings ($)
1.98
1.94
1.86
1.99
2.34
Net asset value ($)
17.09
17.84
18.82
20.37
21.31
Net dividend (cents)3
75
90
70
100
120
Dividend cover (times)3
2.70
2.22
2.73
2.04
2.00
-
With effect from 1 January 2018, operating profit is presented net of fee and commission expense. The comparative figures have been restated to conform with the current period's presentation.
-
Relates to the amount attributable to equity holders of the Bank.
-
Included a special dividend of 5 cents in 2014 and 20 cents in 2017 and 2018 respectively. 2015 included UOB's 80th Anniversary dividend of 20 cents.
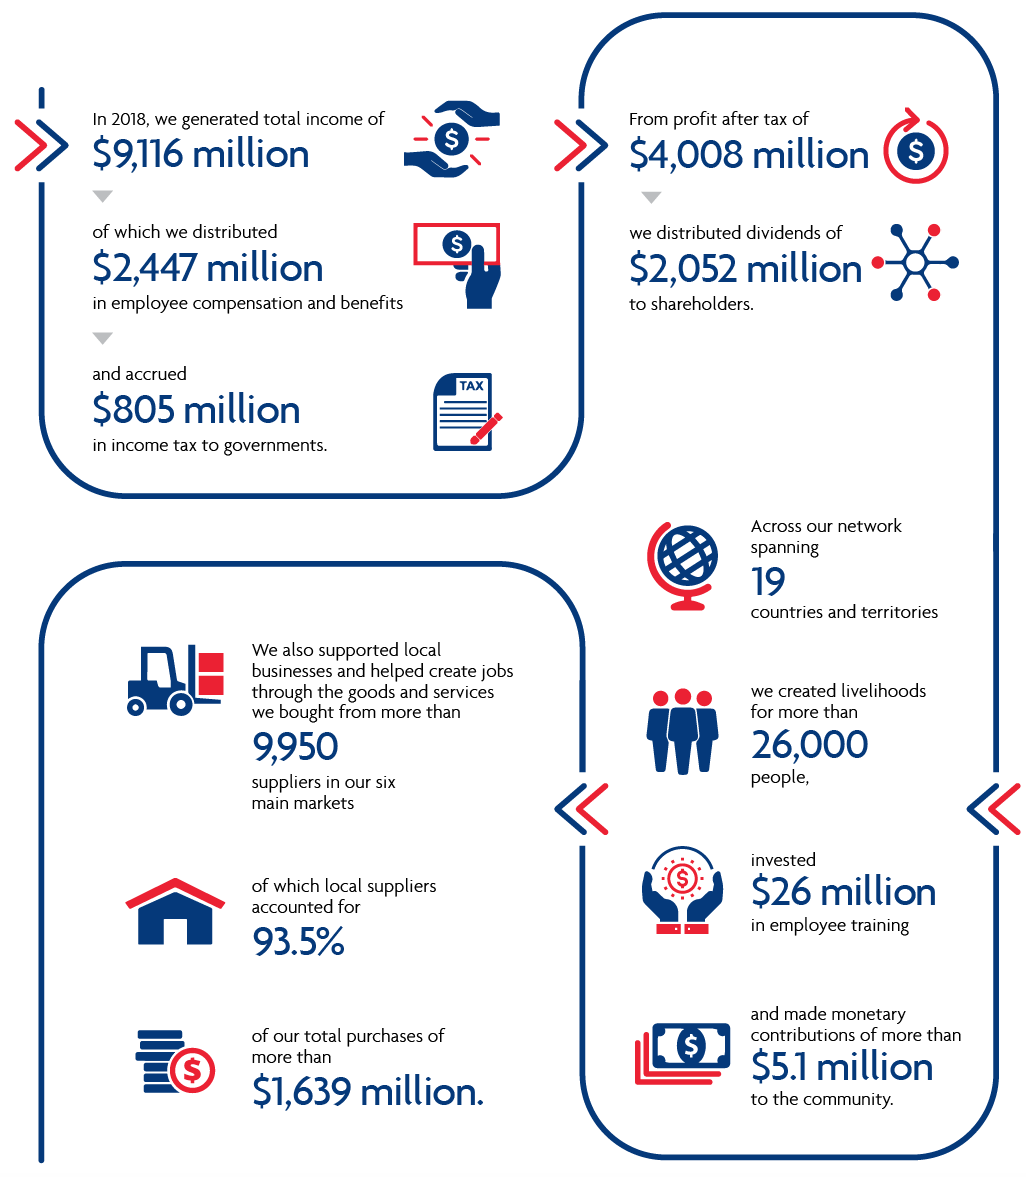
Economic Value of Our Contributions
UOB is committed to contributing to the region’s progress and growth through the direct and indirect economic value we create for our stakeholders.