


Staying focused on our regional strategy and customer centricity
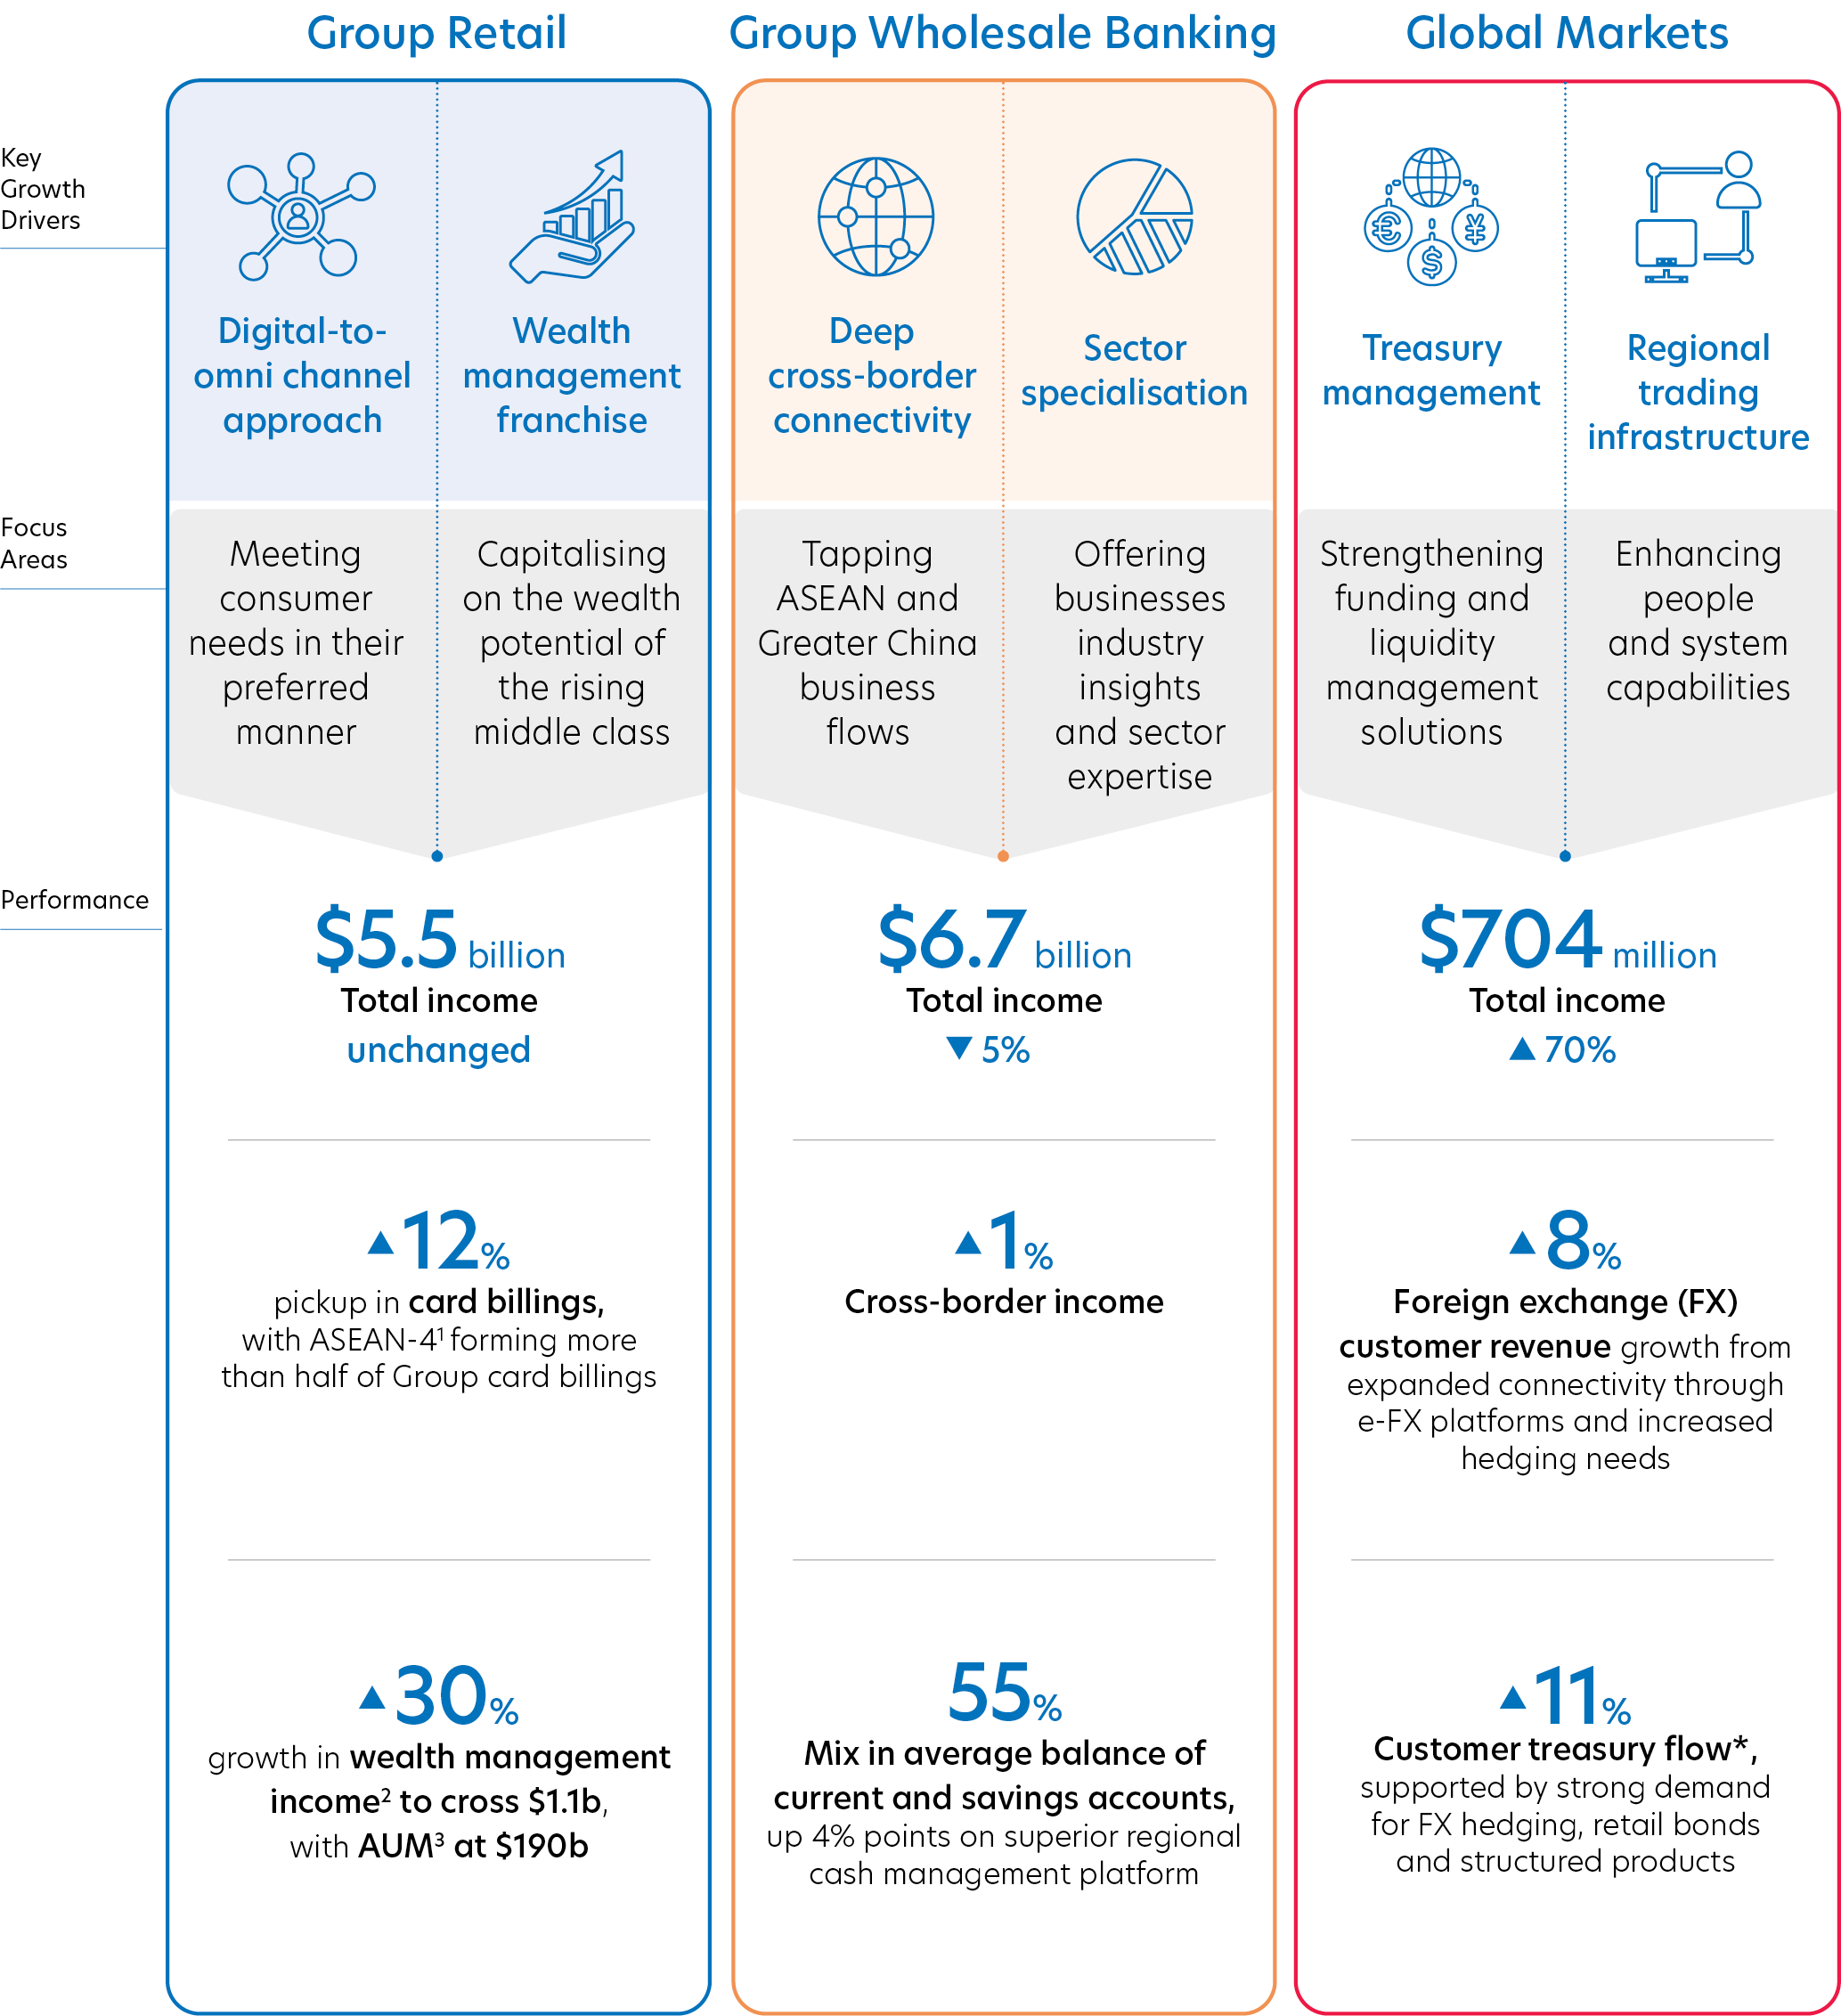
Group Retail
Group Wholesale Banking
Global Markets

Digital-to-omni channel approach

Wealth management franchise
Key
Growth
Drivers
Growth
Drivers
Meeting consumer needs in their preferred manner
Capitalising on the wealth potential of the rising middle class
Focus
Areas
Areas

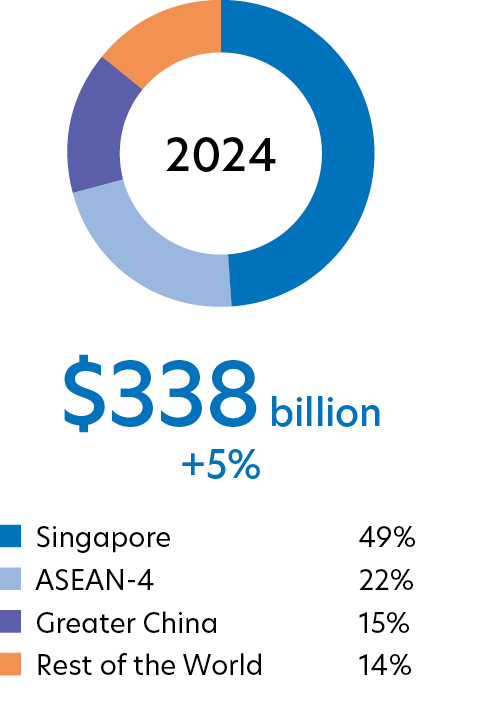
$5.5
billion
Total income
unchanged
Performance

12
%
pickup in card billings, with ASEAN-41 forming more than half of Group card billings
30
%
growth in wealth management income2 to cross $1.1b, with AUM3 at $190b

Deep
cross-border connectivity
cross-border connectivity

Sector specialisation
Tapping ASEAN and Greater China business flows
Offering businesses industry insights and sector expertise
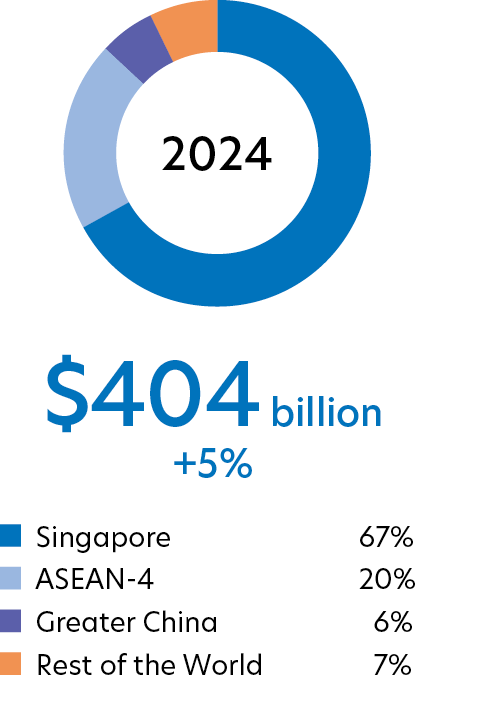
$6.7
billion
Total income
5%
1
%
Cross-border income
55
%
Mix in average balance of current and savings accounts, up 4% points on superior regional cash management platform

Treasury management

Regional trading infrastructure
Strengthening funding and liquidity management solutions
Enhancing people and system capabilities
$704
million
Total income
70%
8
%
Foreign exchange (FX) customer revenue growth from expanded connectivity through e-FX platforms and increased hedging needs
11
%
Customer treasury flow*, supported by strong demand for FX hedging, retail bonds and structured products
*
Income derived from the treasury flow from Group Retail and Group Wholesale Banking customers is reflected in the income of the respective business segments.
1
ASEAN-4 comprises Indonesia, Malaysia, Thailand & Vietnam
2
Comprises wealth management fees and customer-related treasury income
3
Refers to Privilege Banking and Private Bank