


Balancing Growth with Stability for the Long Term / Financial Highlights
Financial Highlights
Resilient earnings driven by strong fee momentum across our diversified franchise
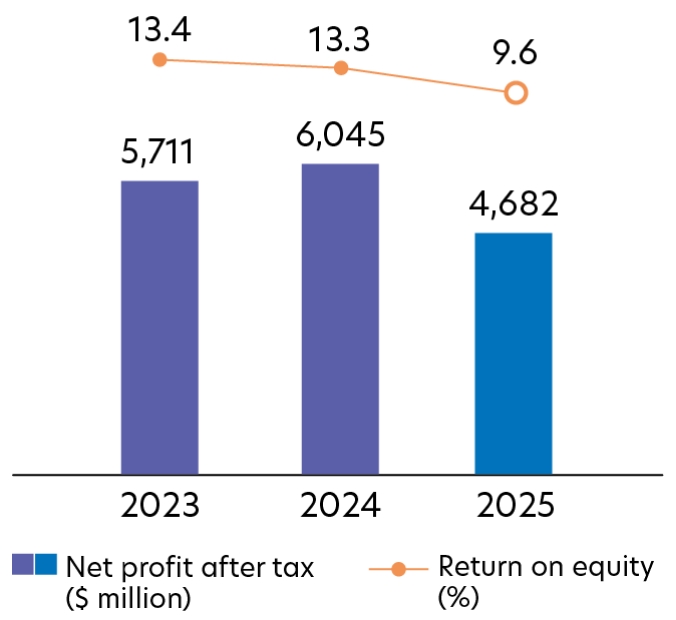
Net Profit After Tax and Return on Equity
Net profit moderated 23% to $4.7 billion primarily due to the Group's proactive decision to strengthen coverage through pre-emptive provisioning in light of evolving macroeconomic conditions and sector-specific challenges.
Net Profit After Tax
$4.7
billion
- 23%
Return on Equity
9.6
%
- 3.7% pt
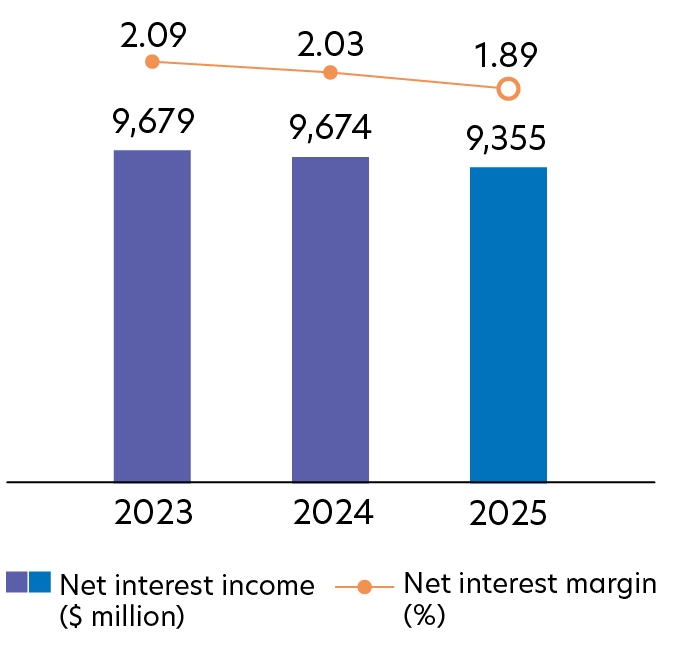
Net Interest Income and Margin
Net interest income fell 3% year on year to $9.4 billion as net interest margin narrowed 14 basis points to 1.89% on the back of lower benchmark rates, cushioned by asset growth.
Net Interest Income
$9.4
billion
- 3%
Net Interest Margin
1.89
%
- 0.14% pt
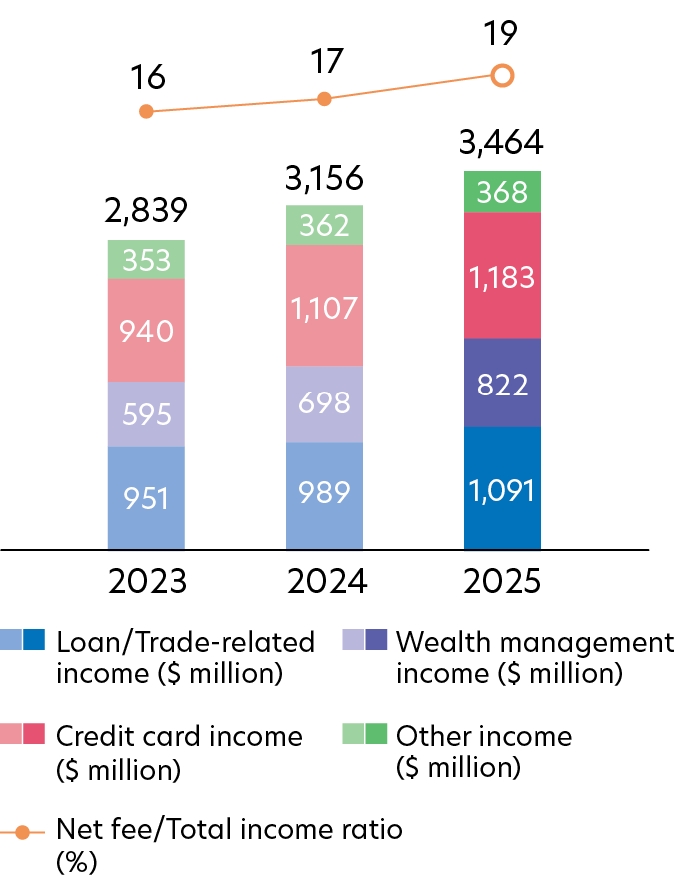
Fee and Commission Income
Gross fee income rose 10% year on year to a new record of $3.5 billion, as wealth management and loan-related fees reached new heights amid favourable market conditions and rising consumer confidence, alongside stronger card fees. On a net basis, fee income grew 7% year on year to $2.6 billion.
Note: Fees presented are gross of expenses, unless stated otherwise
Net Fee Income
$2.6
billion
+ 7%
Net Fee/Total Income
Ratio
Ratio
19
%
+ 2% pt
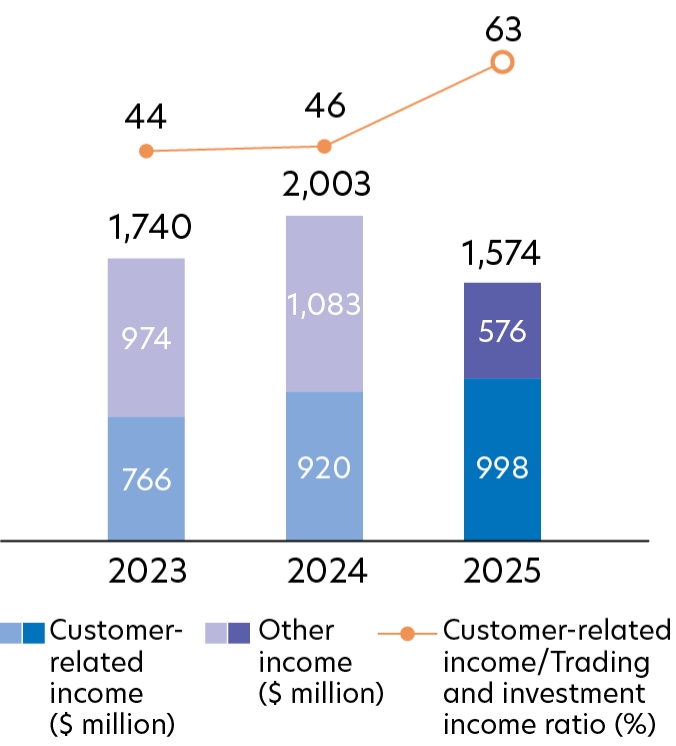
Trading and Investment Income
Trading and investment income came in at $1.6 billion, down 21% from a year ago as trading income and liquidity management activities normalised following last year’s exceptional performance. Customer-related treasury income however registered an all-time high fuelled by strong hedging and investment demand.
Trading and Investment Income
$1.6
billion
- 21%
Customer-related Income
$1.0
billion
+ 8%
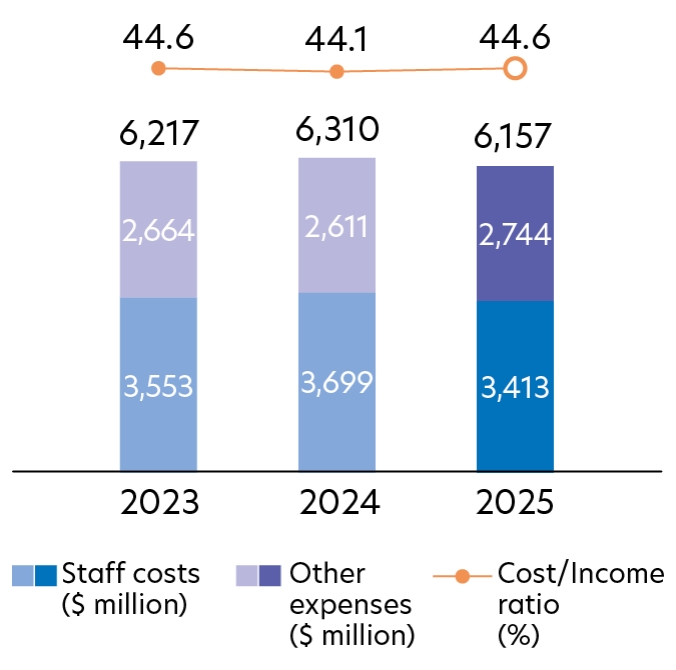
Operating Expenses
Total operating expenses edged down 2% year on year, with cost-to-income ratio at 44.6%, supported by active cost discipline alongside targeted strategic investments.
Operating Expenses
$6.2
billion
- 2%
Cost/Income Ratio
44.6
%
+ 0.5% pt
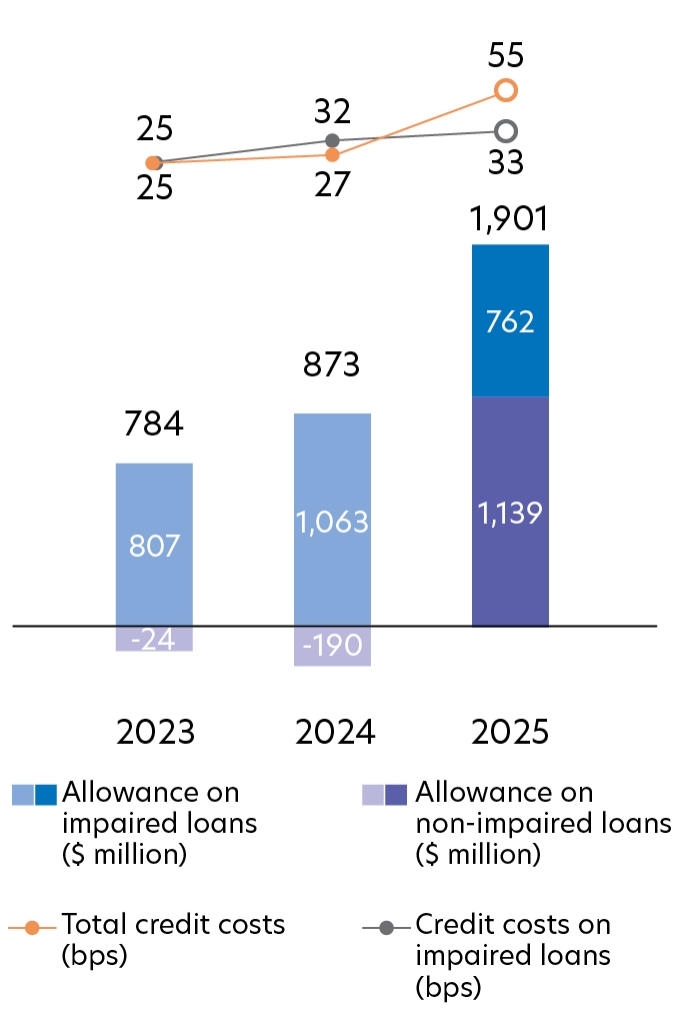
Total Allowance on Loans
Total allowance on loans rose to $1.9 billion in 2025, reflecting pre-emptive provisioning to further reinforce the Group's balance sheet strength.
Total credit costs on loans were 55 basis points.
Total credit costs on loans were 55 basis points.
Total Allowance
on Loans
on Loans
$1.9
billion
> 100%
Total Credit Costs
55
bps
+ 28 bps
Staying focused on our regional strategy and customer centricity
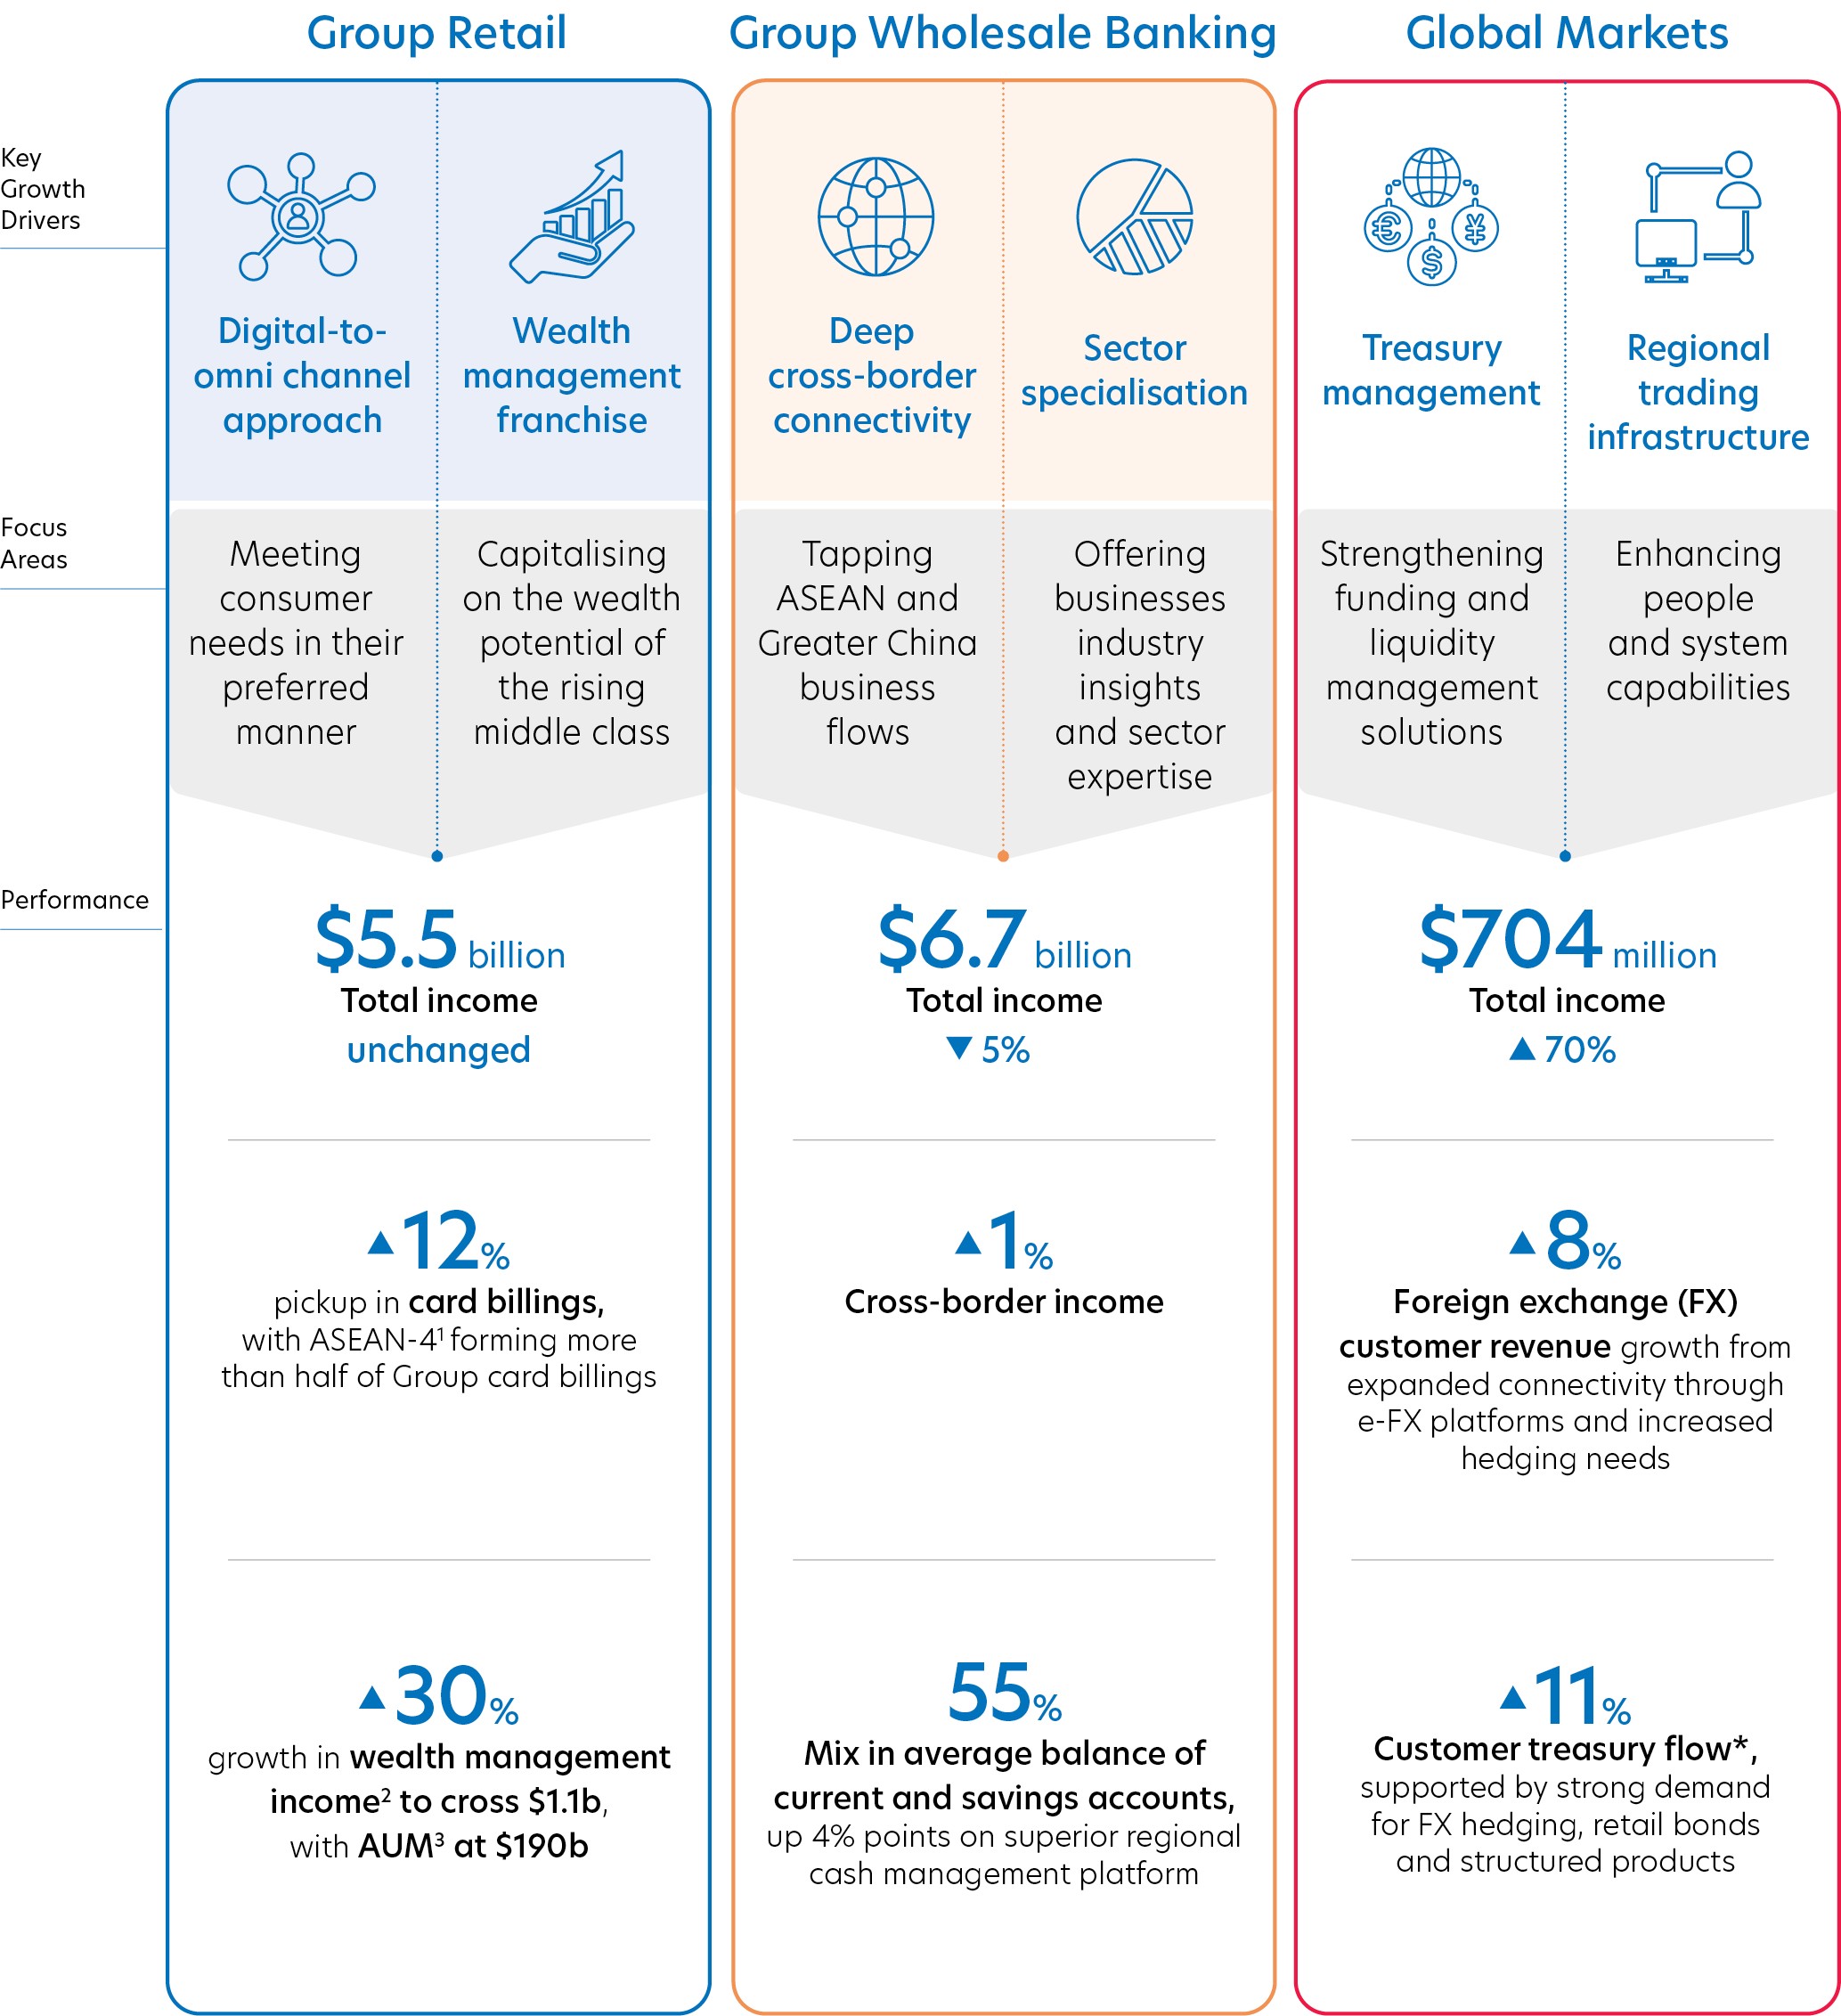
Group Retail
Group Wholesale Banking
Global Markets

Deepening customer relationships across ASEAN

Wealth management franchise
Key
Growth
Drivers
Growth
Drivers
Leveraging our regional strength and depth of offerings to meet rising consumer needs across life stages
Capitalising on the wealth potential of the rising middle class
Focus
Areas
Areas

$5.1
billion
Total income

7%
Performance
8
%
Pickup in card billings,with ASEAN-41 forming more thanhalf of Group card billings
$201
billion
AUM2, with wealth management income3 up 14% to $1.3b

Deep
cross-border connectivity
cross-border connectivity

Sector specialisation
Tapping ASEAN and Greater China business flows
Offering businesses industry insights and sector expertise
$6.2
billion
Total income
7%
27
%
Mix in cross-border income, with 1% point increase
61
%
Mix in balance of current
and savings accounts,
up 4% points on superior regional cash management platform
and savings accounts,
up 4% points on superior regional cash management platform

Treasury management

Regional trading infrastructure
Strengthening funding and liquidity management solutions
Enhancing people and system capabilities
$1.1
billion
Total income
51%
3
%
Foreign exchange (FX) customer revenue growth from expanded connectivity through e-FX platforms and increased hedging needs
4
%
Customer treasury flow*, supported by strong demand for hedging and wealth solutions
*
Income derived from the treasury flow from Group Retail and Group Wholesale Banking customers is reflected in the income of the respective business segments.
1
ASEAN-4 comprises Indonesia, Malaysia, Thailand & Vietnam
2
Refers to Privilege Banking and Private Bank
3
Comprises wealth management fees and customer-related treasury income
Operating Income by Business Segment
Group Retail
Total income eased 7% to $5.1 billion, reflecting the backdrop of falling interest rates and intense competition across key markets. Despite these headwinds, the underlying franchise delivered growth, achieving a double-digit trajectory in wealth management income and CASA balances, supported by strong customer value propositions.
Group Wholesale Banking
Total income reduced 7% amid lower interest rates and keen competition for quality clients across the banking industry. This was partially cushioned by record-high investment banking fees, double-digit growth in CASA and trade assets backed by pan-regional transaction banking platforms, and healthy treasury customer flows.
Global Markets
Total income soared 51% to $1.1 billion, led by lower funding costs, alongside growth in activities across foreign exchange and equities.
Operating Income by Geographical Segment
Overseas franchise provided diversification and cross-border connectivity
$ million
2025
2024
YoY (%)
Singapore
7,549
8,059
(6)
ASEAN-4
3,940
3,770
5
Malaysia
1,656
1,511
10
Thailand
1,470
1,478
(1)
Indonesia
639
629
2
Vietnam
175
152
15
Greater China
1,155
1,230
(6)
Rest of the World
1,164
1,235
(6)
Total
13,808
14,294
(3)
Customer Loans1
Customer Deposits
Singapore
Total income declined 6% from a year ago. Net interest income eased 6% year on year to $5.1 billion due to lower benchmark rates and competitive pricing, partially cushioned by active balance sheet management and quality asset growth. Non‑interest income fell 8% to $2.5 billion as lower trading and investment gains masked record loan fees and double‑digit expansion in wealth management income.
Greater China
Total income moderated 6% year on year to $1.2 billion due to softer performance in proprietary trading, investment, loan and wealth, partially cushioned by higher net interest income.
ASEAN-4
Total income rose 5% from last year, driven by broad-based client activities across lending, proprietary trading, treasury and wealth management. Faster income growth was recorded in Malaysia and Vietnam due to lower funding costs and asset growth respectively, while a falling rates backdrop moderated the income momentum in Thailand.
Rest of the World
Total income for 2025 fell 6% against a year ago to $1.2 billion mainly due to lower benchmark rates, alleviated by stronger trading and investment gains.
1
Loans by geography are classified according to where credit risks reside, largely represented by the borrower's country of incorporation/operation for non-individuals and residence for individuals.
Sound balance sheet with adequate asset coverage
Asset Quality and Allowance Coverage
The Group's performing loans coverage was 1.0% as of 31 December 2025. Non-performing loan (NPL) ratio stood at 1.5%, with non-performing assets (NPA) coverage adequate at 97% or 254% after taking collateral into account.
NPL Ratio
1.5
%
unchanged
Unsecured NPA Coverage
254
%
+ 60% pt
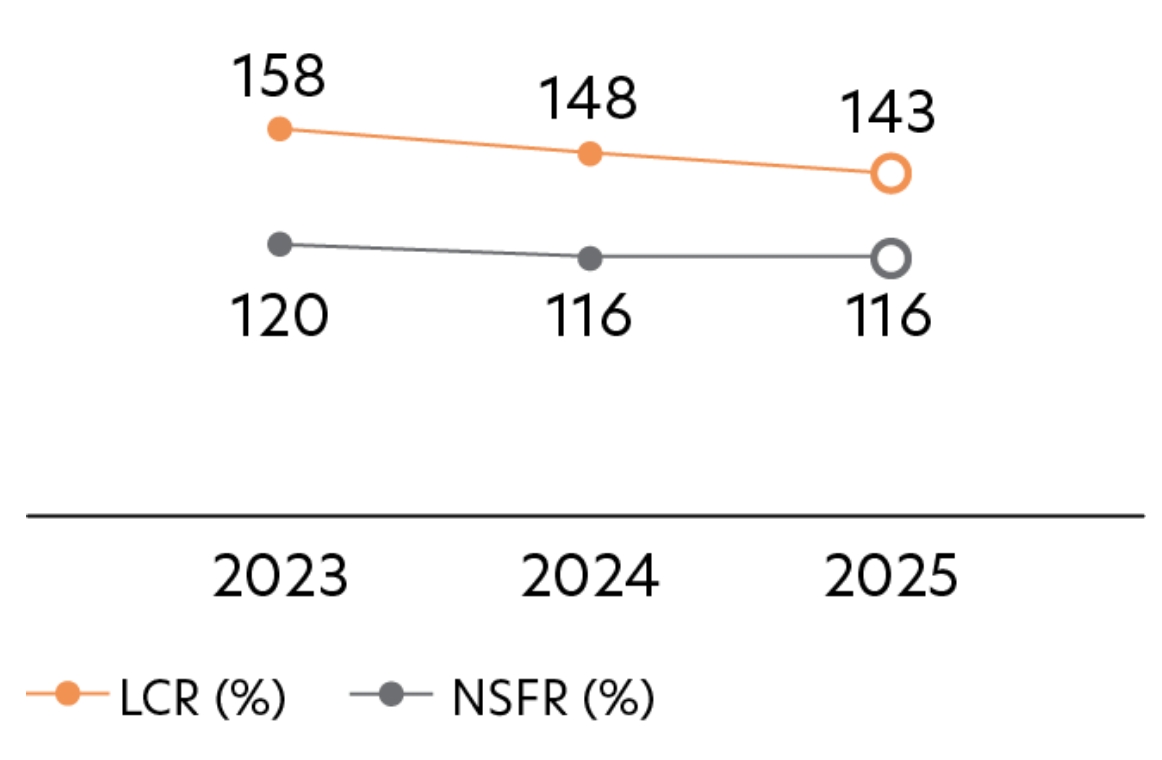
Funding and Liquidity Ratios
The Group’s liquidity remained healthy with the average all-currency liquidity coverage ratio (LCR) at 143% and net stable funding ratio (NSFR) at 116%, well above the regulatory requirements.
LCR
143
%
- 5% pt
NSFR
116
%
unchanged
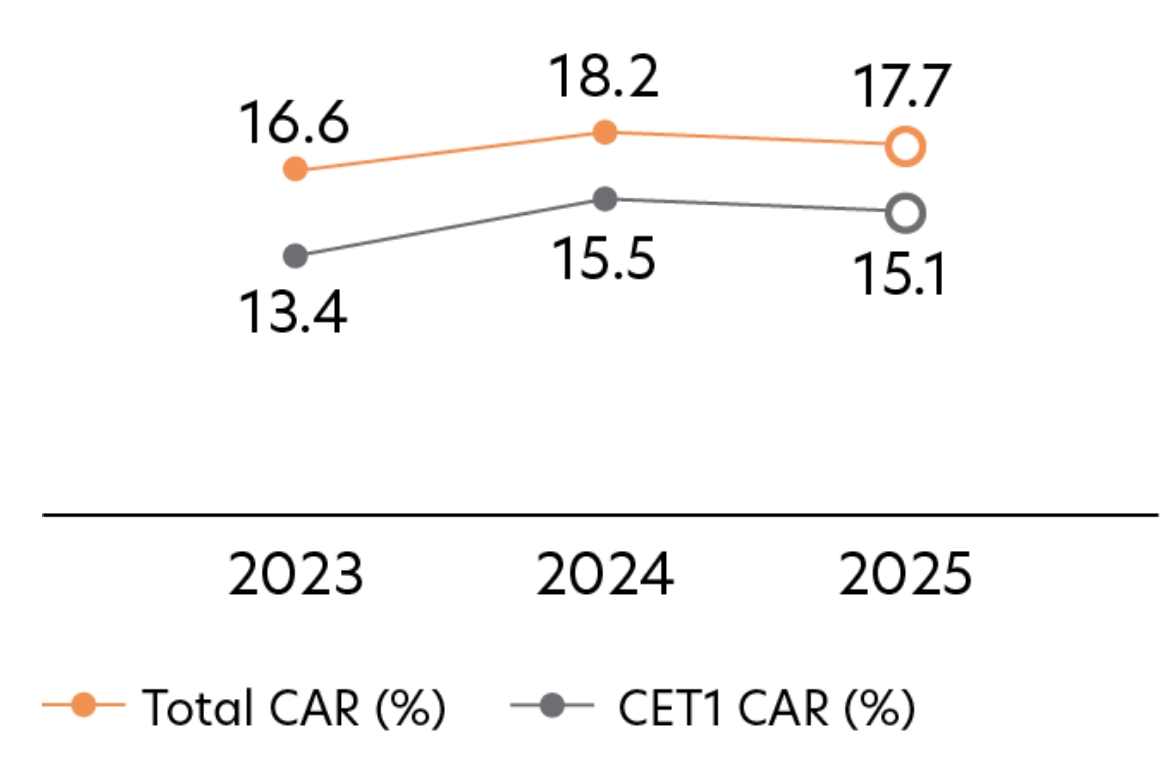
Capital Adequacy Ratio (CAR)
The Group maintained a strong capital position with Common Equity Tier 1 (CET1) CAR and Total CAR at 15.1% and 17.7% respectively.
CET1 CAR
15.1
%
- 0.4% pt
Total CAR
17.7
%
- 0.5% pt
Balancing Growth with Stability for the Long Term
Chairman's Statement
Deputy Chairman and CEO’s Report
Financial Highlights
Investor Highlights
Sustainability Highlights

