


4Q net profit 3% lower quarter on quarter on lower trading and investment income
ASEAN-focused UOB Group has reported total income of S$9.79 billion and net profit of S$4.07 billion for the financial year ended 31 December 2021 (FY21). Against the backdrop of an improving operating environment and a healthy growth in business activities and consumer spending, the Group saw strong performance across customer segments and geographies for the year.
In FY21, the Group’s fee income reached a new high of S$2.41 billion on the back of stellar performance in wealth and loan-related activities. Net interest margin was stable at 1.56% amid a low interest rate environment and with proactive balance sheet management. Asset quality remained resilient with the non-performing loan (NPL) ratio steady at 1.6%.
Group Wholesale Banking income rose 8% to S$4.39 billion, on the back of improved business sentiment as the Group’s strong client franchise drove robust loan and fee growth from large corporate and institutional clients. Cross-border income grew 10%, with business activities picking up towards the end of the year as clients increasingly tapped the Group’s regional connectivity capabilities.
Group Retail’s income was sustained at S$4.11 billion, as the strong recovery in wealth management and credit card activities helped to offset the impact of thinner margins. In particular, assets under management from high affluent customers reached a new record of S$139 billion, with 57% coming from overseas customers served by the Group’s network of wealth management centres in Southeast Asia. The Group’s recent acquisition of Citigroup’s consumer business in Indonesia, Malaysia, Thailand and Vietnam will accelerate its efforts to improve profitability through an expanded customer base and by unlocking business synergies.
In FY21, the Group made significant progress on its sustainability strategy. In addition to achieving operational carbon neutrality, the Group rolled out several well-received sustainable financing solutions with the total sustainable financing portfolio reaching S$17 billion in FY21, well ahead of its 2023 target of S$15 billion. The Group has set a new sustainable financing portfolio target of S$30 billion by 2025. In the area of sustainable investing, the Group’s total assets under management in environmental, social and governance-focused investments grew to S$9 billion during the year.
The Board recommends the payment of a final dividend of 60 cents per ordinary share. Together with the interim dividend of 60 cents per ordinary share, the total dividend for FY21 will be S$1.20 per ordinary share, representing a payout ratio of approximately 49%.
CEO Statement
Mr. Wee Ee Cheong, UOB’s Deputy Chairman and Chief Executive Officer, said, "As we enter the third year of the global pandemic, the overall operating environment has stabilised. We achieved a healthy 40% increase in net profit for FY21 as economic growth, business activities and consumer sentiment picked up.
"We believe the worst is behind us. In Singapore, there are signs of market recovery where we see strong institutional loan growth and a rebound in card spending and wealth management activities. We see significant upside in Southeast Asia, though the pace of recovery may vary by country. Our confidence in the region is underscored by our continued efforts to deepen our customer franchise and to build scale, through organic growth and acquisition.
"The opportunity to acquire Citigroup’s consumer business in Indonesia, Malaysia, Thailand and Vietnam came at the right time, with the right strategic fit. Subject to regulatory approval, the acquisition will double our retail customer base across these four markets. At the same time, we continue to invest in capabilities such as supply chain, sustainability and digitalisation to tap the structural trends propelling our region’s growth. Our strong balance sheet, disciplined business approach and resilient asset quality will position us well for new opportunities as we ride on the region’s recovery."
Financial Performance
FY21 versus FY20
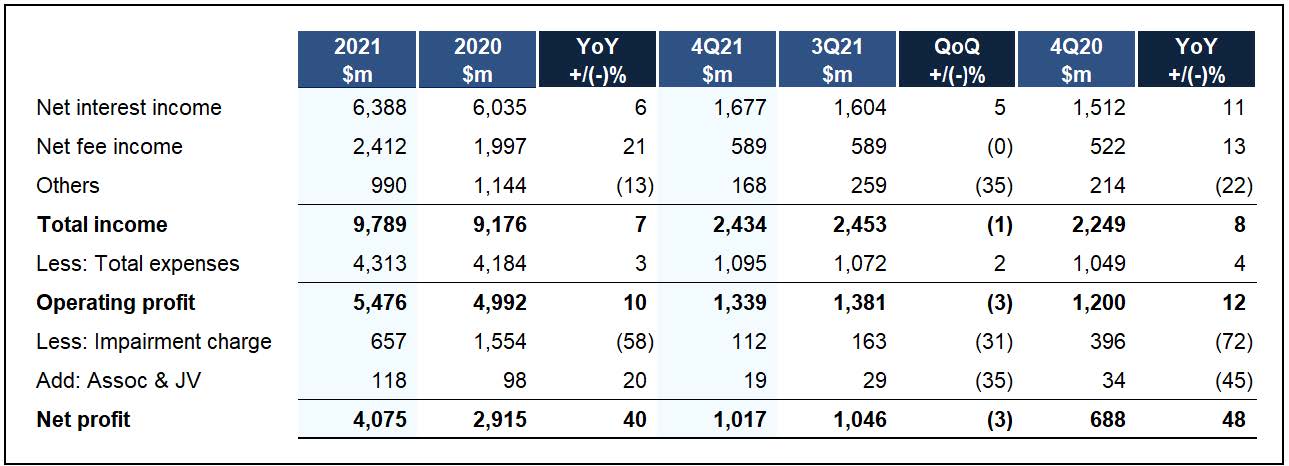
Net profit for FY21 grew 40% to S$4.07 billion on the back of stronger income growth and lower credit allowance as Singapore and regional economies gradually recovered during the year.
Net interest income rose 6% from a year ago to S$6.39 billion, led by healthy loan growth of 10% with net interest margin being stable.
Net fee and commission income rose 21% to a record S$2.41 billion, driven by double-digit growth in most activities. Loan fees hit a new high of S$698 million, as trade and investment transactions picked up momentum. Wealth management fees grew to a record S$823 million on the back of returning investor confidence. Stronger financial market activity also led to higher fund management fees while credit card fees recovered from a pick-up in consumer spending.
Customer-related treasury income grew 10% with more customers hedging exposures alongside returning business volume growth. This was more than offset by lower non-customer trading income as there were larger gains from bond sales and unrealised gains on hedges last year amid the lower interest environment. As such, other non-interest income declined 13% to S$990 million.
The increase of only 3% in total expenses to S$4.31 billion was a result of the Group’s disciplined spend, as it prioritised strategic investments in people and technology, including scaling up digital offerings in Singapore and ASEAN. The cost-to-income ratio for the year improved 1.5% points to 44.1%.
Asset quality remained stable. As pre-emptive general allowance taken in last year remained adequate, total allowance declined 58% to S$657 million and total credit costs on loans decreased from 57 basis points to 20 basis points.
4Q21 versus 3Q21
Net profit for the fourth quarter was 3% lower at S$1.02 billion, compared with 3Q21, on lower trading and investment income despite higher margins and lower credit allowances.
Net interest income increased 5% to S$1.68 billion, lifted mainly by loan growth of 2%. Net fee and commission income was stable at S$589 million, as higher credit card and loan-related fees were offset by seasonal decline in wealth fees. Trading and investment income declined 43% to S$110 million, largely due to lower non-customer related income on the back of sagging market sentiment and seasonally lower transaction volume.
Total operating expenses increased 2% to S$1.10 billion. Total allowance fell 31% to S$112 million, due mainly to a write-back of general allowance with more clarity and confidence of the market outlook.
4Q21 versus 4Q20
Net interest income increased 11%, led by strong loan growth of 10%. Net fee and commission income was 13% higher, driven by strong growth in loan-related fees and credit card fees. Other non-interest income declined 22% to S$168 million, mainly from lower non-customer treasury income.
In tandem with strong income growth and disciplined cost management, the cost-to-income ratio improved from 46.7% to 45.0%. Total allowance decreased to S$112 million, largely due to lower general allowance.
Asset Quality
Asset quality remained resilient with the NPL ratio steady at 1.6% in 4Q21. The non-performing assets coverage remained strong at 96% or 239% after taking collateral into account. While the path to recovery is clearer compared with a year ago, the Group continued to maintain performing loans coverage prudently at 1%.
Capital, Funding and Liquidity Positions
The Group’s liquidity and funding positions remained healthy with 4Q21’s average all-currency liquidity coverage ratio at 133% and net stable funding ratio at 116%, well above the minimum regulatory requirements. The loan-to-deposit ratio was stable at 87.0%.
As at 31 December 2021, the Group's Common Equity Tier 1 Capital Adequacy Ratio remained strong at 13.5%. Leverage ratio of 7.2% was more than two times above the regulatory requirement.
Click here to download the FY21 Condensed Financial Statement